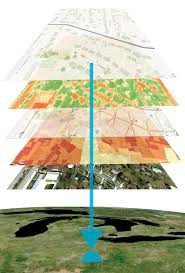
Support to our research projects has been extended through the use of GIS software. Where relevant it is possible to create a database for any aspect of our research and to relate our findings/obsevations to a specific point, line or area through the addition of National Grid coordinates.
The specific database content can be loaded into QGIS and overlayed on published background maps or other layers derived from our research. These maps can be prepared so they can be shared on our website.
Sharnbrook Archaeology
All Excavations by Project Locationshttps://slhg.org.uk/wp-content/gismaps/qgis2web_2017_08_31-12_06_03_766000/index.html#15/52.2262/-0.5491
Pottery Distribution by Pottery Type Pottery Finds https://slhg.org.uk/wp-content/gismaps/qgis2web_2017_08_31-14_25_32_482000/index.html
All Excavations by Project https://slhg.org.uk/wp-content/gismaps/qgis2web_2017_08_31-12_06_03_766000/index.html#15/52.2262/-0.5491
Slag Distribution (graduated by weight) https://slhg.org.uk/wp-content/gismaps/qgis2web_2017_07_15-16_48_44_765000/index.html#15/52.2259/-0.5465
Clay Pipe Distribution (graduated by number) https://slhg.org.uk/wp-content/gismaps/qgis2web_2017_07_15-16_50_22_944000/index.html#15/52.2259/-0.5465
This approach is also being used for other local history data generated during our research programme. It is being merged with data sources provided under arrangement with Bedford Borough’s HER Department and Archive.
The following map is an example of how we intend to move forward. It shows a single location – Toft Manor . By clicking on that location’s symbol it opens the table of attributes for that location and the table includes a link to a webpage where additional information is provided. In this instance we have 1911 census data, 1911 Second Domesday, 1925 Land Tax Evaluation, WWII events together with the HER dataset and some additional photographs from our own Photo archive.
Tofte Manor example https://slhg.org.uk/wp-content/gismaps/qgis2web_2017_11_14-12_03_59_934000/index.html#15/52.2260/-0.5465
The extension to non-archaeological data includes the analysis of the 1925 Rate Evaluation data -the first map created shows a graduation based on the Rateable Values of the properties or Land in the village at that time. We will subsequently create more maps showing things such as
- the extent of ownership by the individuals or
- the size of the property
1925 Rate Evaluation ( graduated by RV in pounds) https://slhg.org.uk/wp-content/gismaps/qgis2web_2017_11_14-13_20_45_570000/index.html
War Memories (draft preliminary map) https://slhg.org.uk/wp-content/gismaps/qgis2web_2020_11_02-11_09_46_750010/index.html
Monuments The extension to non-archaeological data includes the Monument Database from St Peter’s – graveyard only. There are two maps one showing graves by plot number one the second by person’s name. In both cases you can zoom/move within the map and you can ‘hover’ above the plot to see full details of the grave.
Monuments by Number https://slhg.org.uk/wp-content/gismaps/qgis2web_2020_11_08-16_15_33_128242/index.html
Monuments by Name https://slhg.org.uk/wp-content/gismaps/qgis2web_2020_11_08-16_08_40_035988/index.html